Lesson 11.2 · Reading time: ~11 min
This lesson focuses on practical use of date and time functions in SQL for analytics. You will learn how to extract periods from temporal fields, aggregate data by day and month, calculate intervals between events, and build working reports based on time metrics. By the end of this lesson, you will be able to confidently analyze time-based dynamics in the Sakila database.
Practical Use of Date and Time Functions for Data Analysis
In the previous lesson, we covered practical string processing. Now we move to another data type that appears in almost every real task: date and time.
In analytics, it is not enough to just display payment_date or rental_date. In practice, you need to answer questions such as: how activity changes by day, what hours have the most transactions, how long it takes from rental to return, and whether there are seasonal peaks.
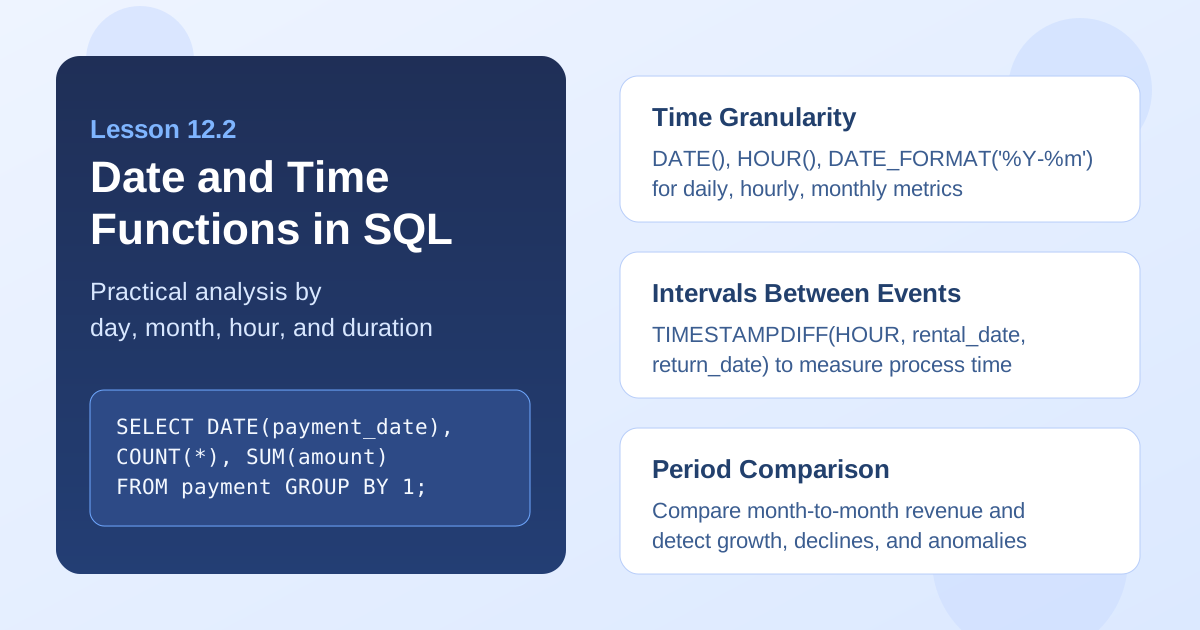
Why Date and Time Functions Matter in Analytics
Almost every report has a time dimension. Even if the business question is “how many sales” or “how many customers,” in practice you usually need time context: per day, week, month, quarter, or a specific period.
Date and time functions help you:
- extract the required granularity (day, month, hour);
- aggregate metrics over time;
- compare periods with each other;
- calculate process durations;
- detect abnormal spikes and drops.
Core Functions Used Most Often
In MySQL, these functions are especially useful for practical analytics:
DATE()- get only the date fromDATETIME;YEAR(),MONTH(),DAY()- extract date parts;HOUR()- analyze hourly activity;DATE_FORMAT()- build a convenient time key;TIMESTAMPDIFF()- calculate interval between two moments;DATEDIFF()- difference in days.
Let us walk through practical scenarios using Sakila data.
Aggregating Payments by Day
A first practical scenario is to see how payment volume changes by day.
SELECT
   DATE(payment_date) AS payment_day,
   COUNT(*) AS payments_count,
   SUM(amount) AS total_amount
FROM payment
GROUP BY DATE(payment_date)
ORDER BY payment_day;
Result: you get daily dynamics of payment count and revenue amount.
This report is useful as a baseline layer for activity monitoring and sudden-change detection.
Monthly Comparison with DATE_FORMAT
When you need a more compact view, aggregate data by month.
SELECT
   DATE_FORMAT(payment_date, '%Y-%m') AS year_month,
   COUNT(*) AS payments_count,
   ROUND(SUM(amount), 2) AS revenue
FROM payment
GROUP BY DATE_FORMAT(payment_date, '%Y-%m')
ORDER BY year_month;
Note: %Y-%m is convenient for both sorting and BI visualization.
If you keep only month number without year, same months from different years will collapse into one group.
Hourly Activity Analysis
A common practical question is: at what hours do users perform more actions?
SELECT
   HOUR(payment_date) AS payment_hour,
   COUNT(*) AS payments_count,
   ROUND(SUM(amount), 2) AS total_amount
FROM payment
GROUP BY HOUR(payment_date)
ORDER BY payment_hour;
Result: you get activity distribution by hour of day.
This helps with load planning, campaign timing, and operational scheduling.
Calculating Rental Duration
Time functions are often used to analyze event lifecycle. In Sakila, you can measure how many hours pass between rental and return.
SELECT
   rental_id,
   rental_date,
   return_date,
   TIMESTAMPDIFF(HOUR, rental_date, return_date) AS rental_duration_hours
FROM rental
WHERE return_date IS NOT NULL
ORDER BY rental_duration_hours DESC
LIMIT 10;
Result: the query shows the longest completed rentals.
For a summary view, it is useful to aggregate duration by average and median (if your DBMS supports median functions).
Practical Report: Average Return Time by Weekday
Now let us combine time functions and aggregation in one applied query.
SELECT
   DAYOFWEEK(rental_date) AS week_day,
   COUNT(*) AS rentals_count,
   ROUND(AVG(TIMESTAMPDIFF(HOUR, rental_date, return_date)), 2) AS avg_return_hours
FROM rental
WHERE return_date IS NOT NULL
GROUP BY DAYOFWEEK(rental_date)
ORDER BY week_day;
Result: you get average rental duration by weekday.
This report helps identify behavior patterns and adjust operational rules by day.
Comparing Current and Previous Periods
In real analytics, it is important not only to calculate metrics but also to compare periods. Even a simple two-range comparison gives useful signal.
SELECT
   CASE
      WHEN payment_date >= '2005-07-01' AND payment_date < '2005-08-01' THEN 'period_1'
      WHEN payment_date >= '2005-08-01' AND payment_date < '2005-09-01' THEN 'period_2'
   END AS period_label,
   COUNT(*) AS payments_count,
   ROUND(SUM(amount), 2) AS revenue
FROM payment
WHERE payment_date >= '2005-07-01'
  AND payment_date < '2005-09-01'
GROUP BY period_label
ORDER BY period_label;
Note: this pattern scales easily to week-over-week, month-over-month, and quarter-over-quarter comparisons.
Practical Recommendations
- Define required granularity in advance: day, week, month, or hour.
- For stable period sorting, use a lexicographically sortable format (
YYYY-MM). - Explicitly filter incomplete events (
return_date IS NOT NULL) when calculating intervals. - Check source timezone when analyzing hourly activity.
- Use clear
>=and<boundaries for period comparison to avoid overlaps.
Key takeaways from this lesson:
- Date and time functions in SQL are essential for practical trend and seasonality analytics.
DATE,DATE_FORMAT,HOUR,TIMESTAMPDIFF, andDATEDIFFcover most real-world tasks.- Time granularity directly affects how metrics should be interpreted.
- Event interval analysis helps measure process efficiency.
- Even simple period comparisons provide valuable decision-making signal.
Frequently Asked Questions
Why is >= start and < end often better than BETWEEN?
Because this format gives clear, non-overlapping intervals, especially for DATETIME. It reduces the risk of double counting at boundaries.
When should I use DATE_FORMAT versus YEAR() and MONTH()?
DATE_FORMAT is convenient for ready-to-use reporting keys (for example, 2025-08). YEAR() and MONTH() are useful when you need separate year/month logic or additional calculations.
What most often breaks time-based analysis?
Typical issues are mixed timezones, wrong granularity, incomplete records (NULL in return_date), and unclear period boundaries.
Interview Questions
How would you explain the difference between DATEDIFF() and TIMESTAMPDIFF()?
DATEDIFF() returns difference in days between dates. TIMESTAMPDIFF() lets you choose a unit (hours, minutes, days, etc.) and is better for more precise interval analysis.
Why is choosing the right time granularity important in reports?
Because granularity defines interpretation: daily analytics highlights operational fluctuations, while monthly analytics highlights trend. Wrong aggregation level can hide important patterns.
How would you validate a time-based report before publication?
I would verify period boundaries, timezone assumptions, NULL handling, interval overlap absence, and then reconcile totals with a control sample from raw data.
In the next lesson, we will move to data transformation techniques for analysis and see how to combine time-based and conditional calculations in one query.